Written by Erin Canter, Manager of Science Literacy and Research at Tremont
A few weeks ago, you may have noticed some orange, smoky skies. This smoke traveled to the Great Smoky Mountains all the way from the fires in the western parts of the U.S. and Canada.
 At Tremont, we’re known for some of our community science projects – bird banding, otter spotting, monarch tagging, and salamander monitoring are all popular projects that attract and include volunteer scientists of all ages and backgrounds. Now, we’re adding a new method of monitoring to the list — air quality monitoring.
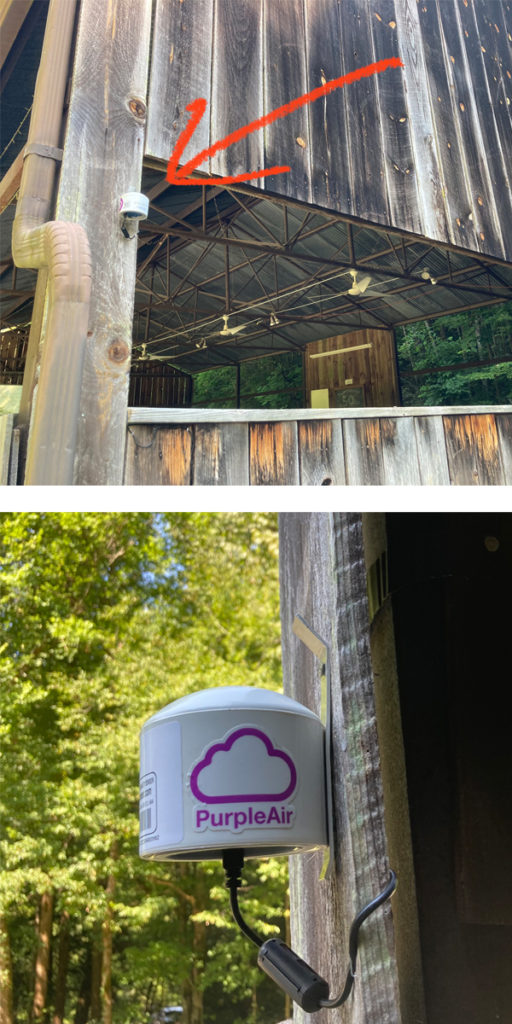
If you wander around Tremont’s campus, you may notice a small, white attachment on the side of our pavilion. This little device is one of thousands installed around the U.S. and abroad that measures air quality and uploads it in real time to the Purple Air Website.
Recently we have seen an increase in fire intensity across the U.S., an increase in park visitation (and thus vehicle exhaust) in the Smokies, and changes in the management and use of coal-fired power plants within our communities. How will these changes affect the air quality of the Great Smoky Mountains National Park? What patterns can we observe that link external sources of air pollution or their mitigation to our homes or local protected spaces?
In the case of the recent fires in the western U.S., air quality monitoring in the park allowed Jim Renfro, the park’s air quality specialist, to issue more timely warnings to keep staff and visitors safe. Concentrations of fine particulate matter exceeded health limits in the Great Smoky Mountains National Park and a “code orange” was issued. This means little particles in the air (2.5 micrometers in length or smaller — that’s a tiny fraction of the width of a single human hair) that can cause respiratory distress made the air dangerous for at-risk groups, including those who suffer from asthma or respiratory disease.
Greater coverage for air quality monitoring will allow us to keep track of changes in air quality and data can be used to inform policies and management decisions that promote improved air quality for our communities — human and otherwise.

This map from the Purple Air website shows the change in air quality around the wildfires in the western United States.
How can you get involved?
You can buy and install your own purple air monitor near your home or (with permission) place of work. You simply need a wifi connection and a place to plug in the device.
Perhaps more importantly, familiarize yourself with the parameters used in the map of monitors. In the lower-left side, be sure to set the Conversion to “US EPA,” as this automatically adjusts the raw reading to align with more precise monitoring tools. Set the Map Data Layer to “Raw pm 2.5 ug/m2” to access the fine particulate matter readings. What patterns do you notice in your region? Do they change over time? Can you connect your air quality readings to events occurring nearby or even across the country? How can you advocate for clean air in your neighborhood?
