
Making Sense of Salamanders
Written by Grayson Shelor, George Fry Chair for Science Education at Tremont
Aquatic salamanders are typically silent swimmers, yet at Tremont, their passage is often marked by squeals of excitement. Get the bag! Don’t drop the rock! I want to see it too!
Salamanders are often a Tremont visitor’s first introduction to amphibians. From four-year-olds at Firefly Camp to adults in our Southern Appalachian Naturalist Certification Program, Tremont’s program participants find salamanders fascinating, from the tips of their snouts to their tiny, almost-humanlike hands and their flexible rudders of tails.
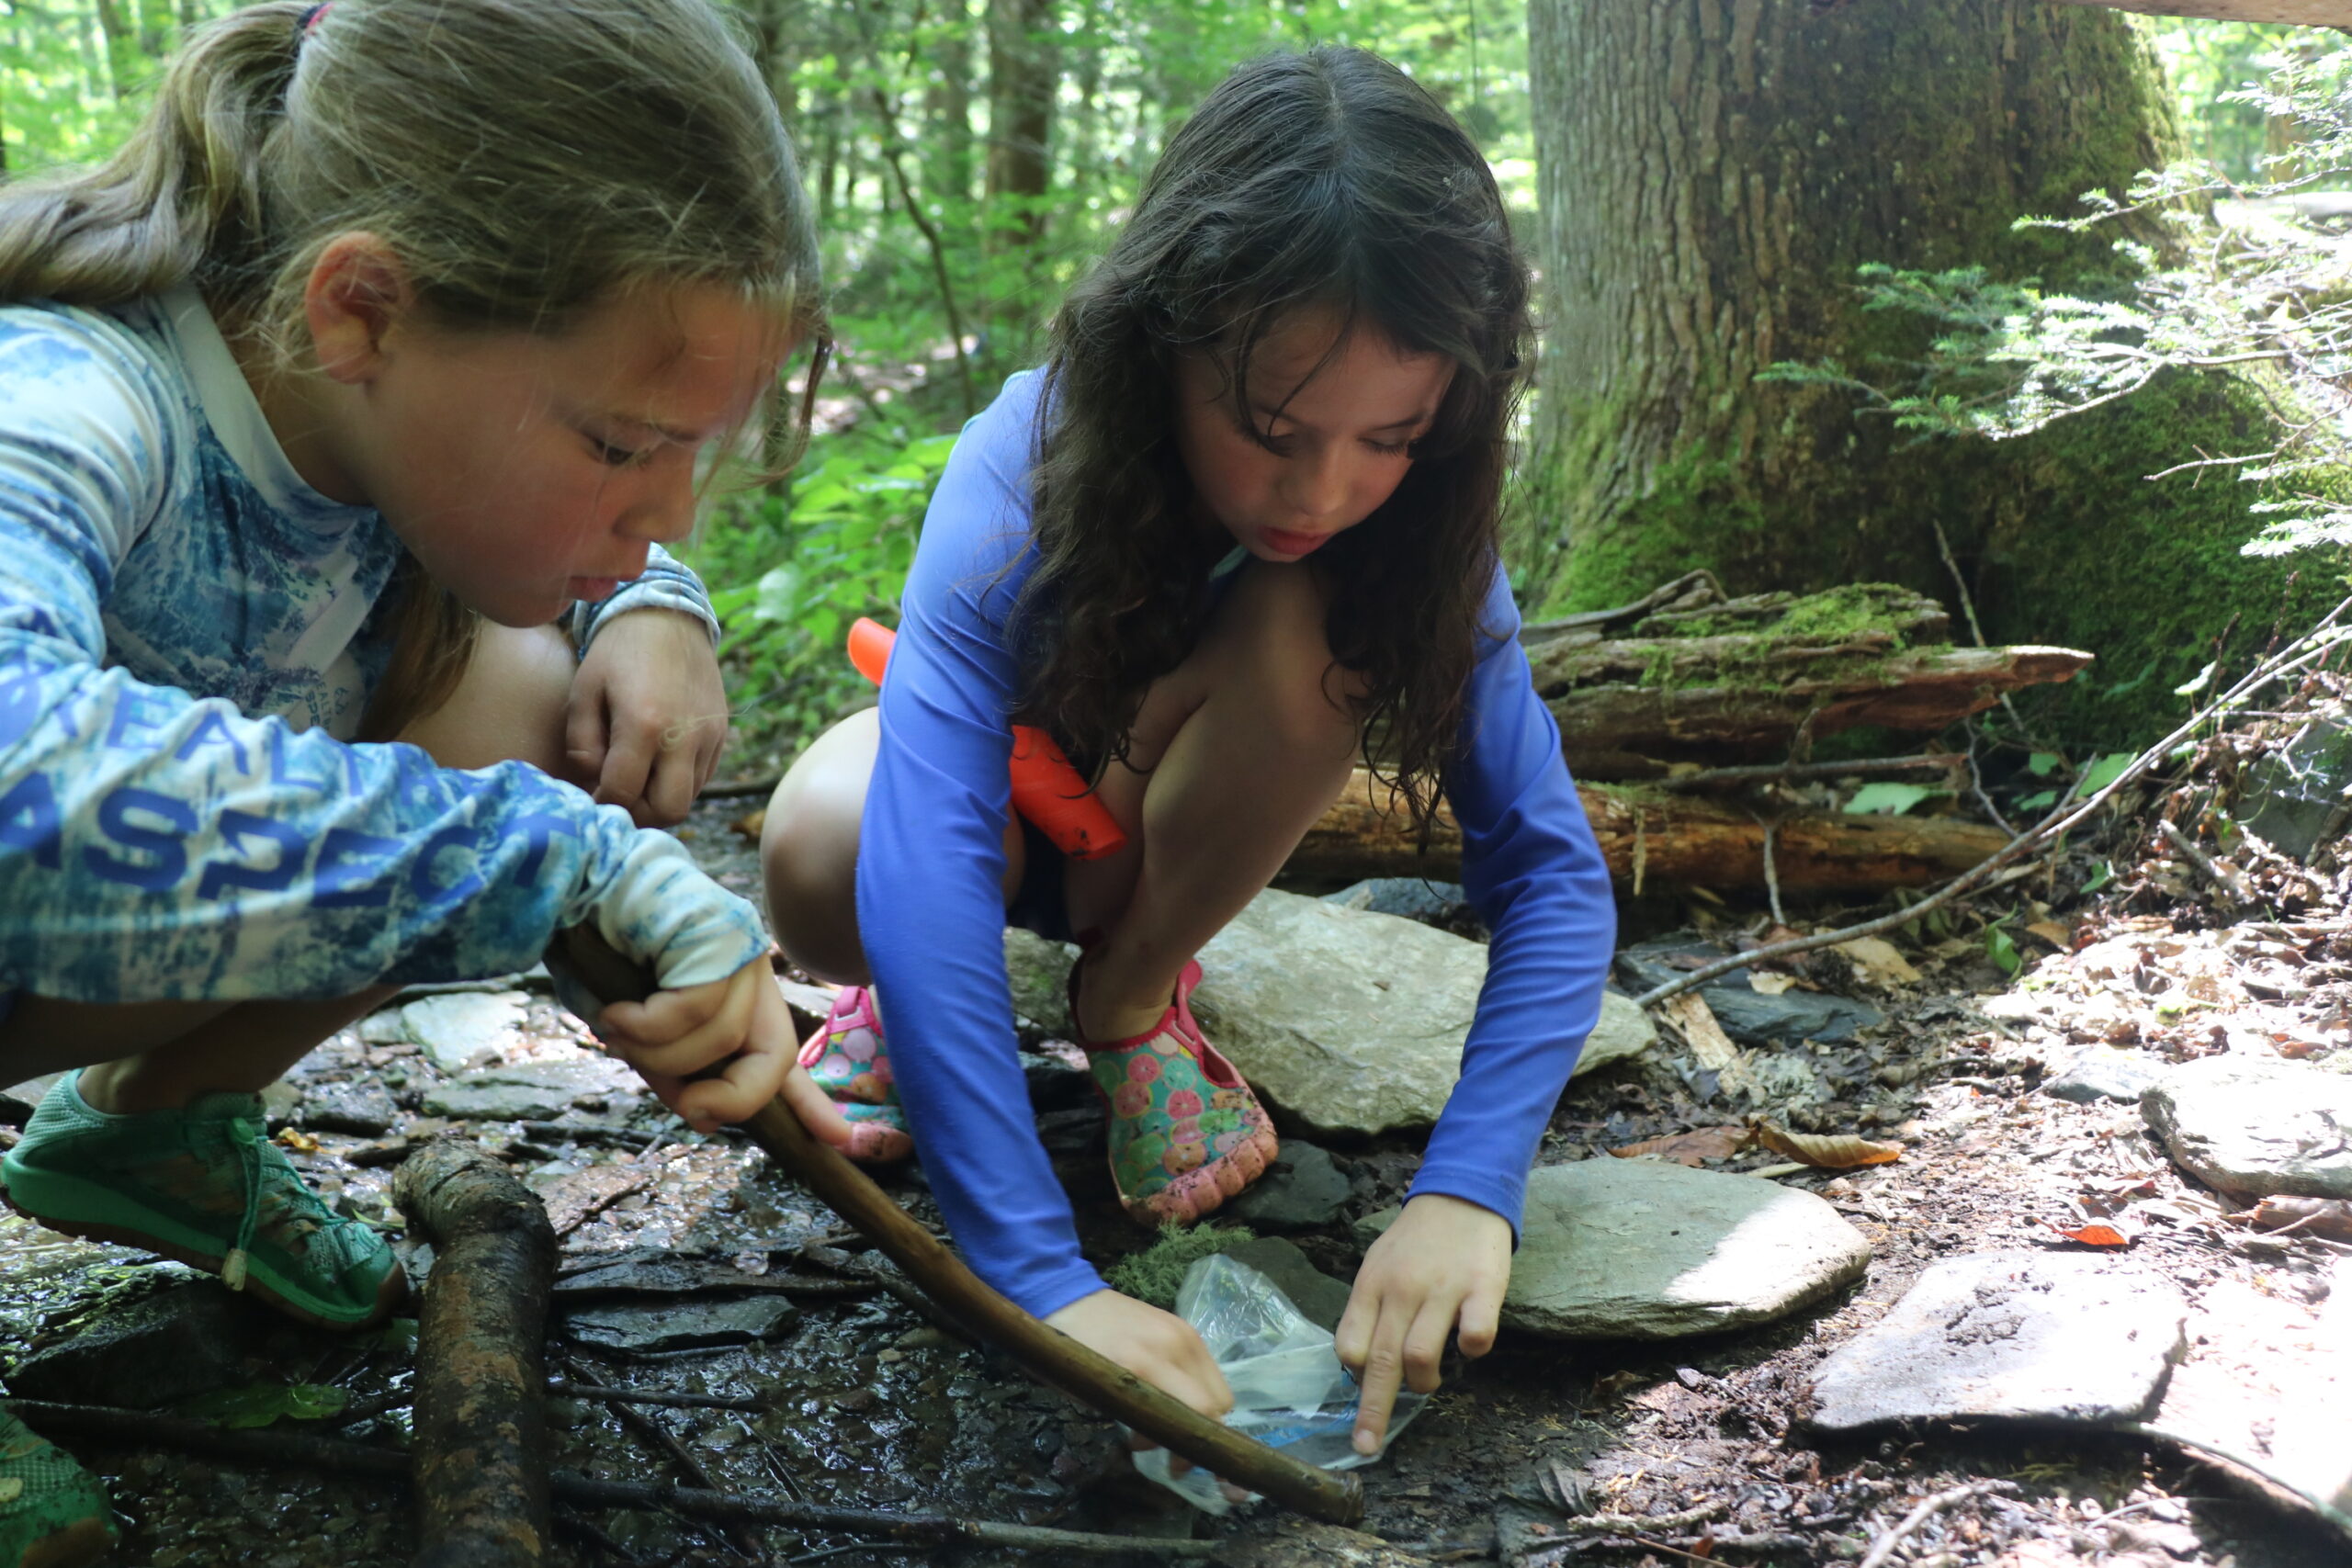
Tremont Firefly campers encourage a salamander into a protective bag. Photo by Erin Rosolina
Holding a salamander (typically through the protective barrier of a transparent zipper bag) is a weighty responsibility, despite their light mass. Their tails have been known to detach under trauma, a consequence that –while survivable and impermanent– represents an enormous energy drain for the specimen. Additionally, given that amphibians breathe through their skin, human contact can introduce contaminants like oils, sunscreen, or bug spray that put our new friends at risk.
Because the water in which they swim is inextricably entwined with their individual well-being, salamanders belong to a class of organisms often called indicator species. Through their numbers, status, and species diversity, we are able to infer crucial information regarding the health of our streams, as well as the forest that surrounds them. How does the stream’s flow rate affect the life within? Is water temperature on the rise? Is stream pH or turbidity linked to our forest management practices? How do these factors affect species diversity? Are certain streams serving as nurseries or refuges for our rarest and most vulnerable salamander species? Is there safe terrestrial habitat for adult salamanders leaving streams, as well as the water to which they will return?
Of the many waterways that flow into our beloved Middle Prong, five are survey sites whose salamander populations are monitored by loyal community science volunteers. Monthly survey site observations, photographs, data readings, and salamander IDs collected by these volunteers join a cumulative record of salamander and stream monitoring at Tremont reaching back to 1999.

Tremont’s watershed and stream survey sites.

A dichotomous key guides salamander species ID
Every episode of monitoring a stream gives us a point-in-time snapshot of which organisms are able to thrive there. By using the vast sea of collated data from many years of surveys, we’re able to move beyond the snapshot to ask bigger questions and notice overall trends and patterns. Which streams seem to be the best fit for high populations of salamanders? Are they the same streams that allow for the greatest range of species? Are there certain streams that lend themselves well to less common species, but yield lower numbers of generalists?
To begin to answer these questions, let’s embark on a data analysis and visualization journey using fairly recent data–from January 2019 through June 2022. First, it’s helpful to know how many salamanders we’re dealing with.
Table 1: Salamanders Observed by Species
| Species | Total # Observed |
| Spotted Dusky Salamander | 36 |
| Cherokee Black-Bellied | 104 |
| Seal Salamander | 203 |
| Unidentified Dusky Species | 100 |
| Long-Tailed Salamander | 3 |
| Blue Ridge 2-Lined | 111 |
| Spring Salamander | 31 |
| Southern Red-Backed | 1 |
| Black-Chinned Red | 2 |
| Unidentified salamander | 49 |
| Sum | 640 |
(This data omits the 1,524 times that survey nets did not contain salamanders, but that number is important in capturing the persistence of our monitoring teams!)
While the table above does offer some idea of the relative commonality of each salamander species that calls Walker Valley home – 8* of the 31 species native to Great Smoky Mountains National Park are represented in this data -, we need deeper immersion to learn more about distinctions between the Tremont streams as microecosystems.
Figure 1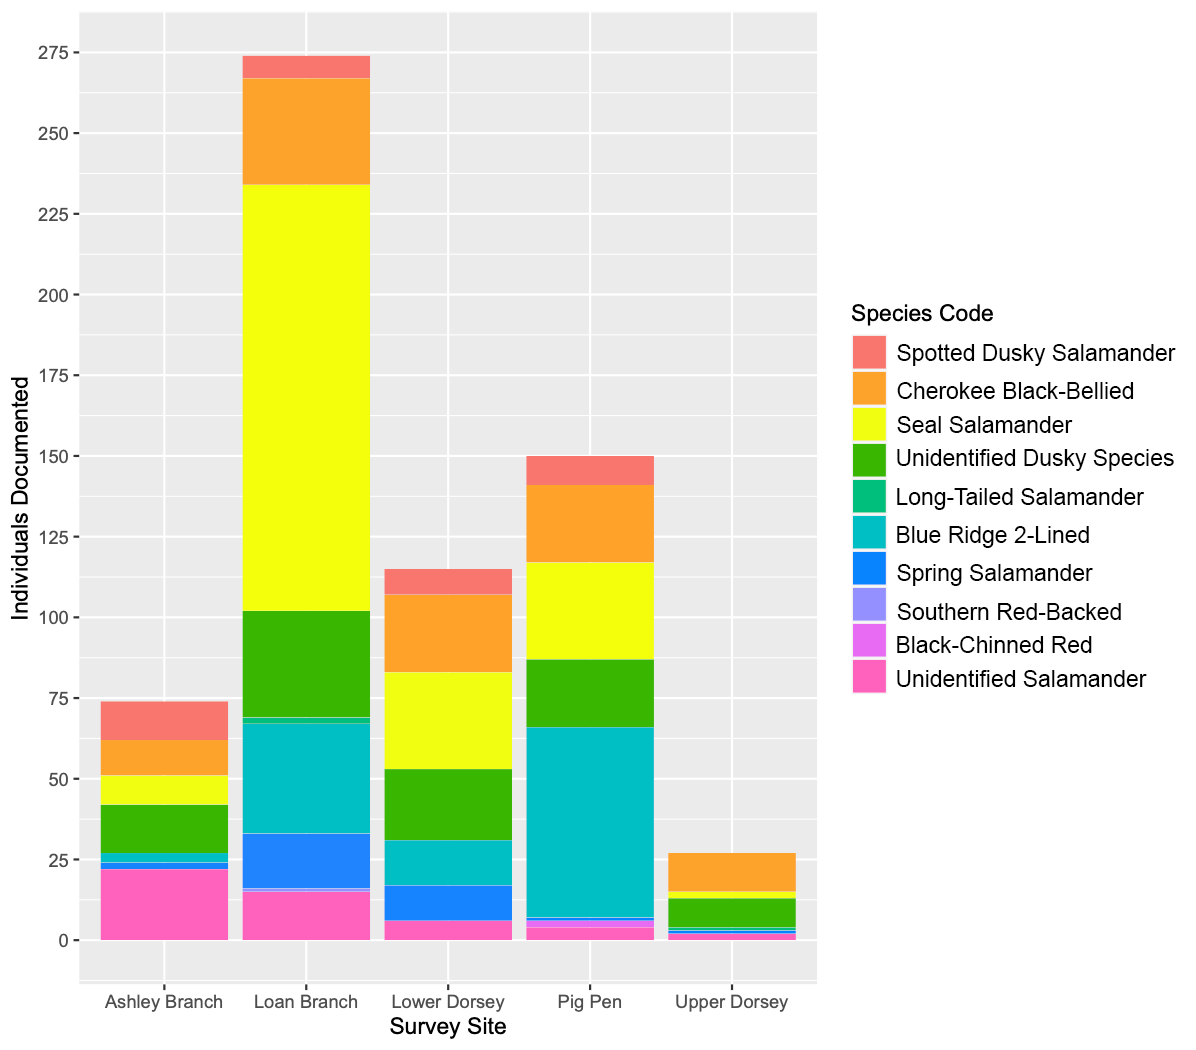
Figure 1: Absolute abundance of salamander species from January 2019-June 2022. Refer to Table 1 for n values from each stream. Graphics created using RStudio data analysis software.
Figure 1 represents the absolute abundance–the total number of individuals documented–of salamander species by stream. It presents us with some interesting findings. Within the 2019-2022 data, only the Loan Branch survey site seems to have been host to all 8 species. Additionally, while the population of Cherokee Black-Bellied Salamanders (newly reclassified as D. gvnigeuswotli, from the Cherokee ᎬᏂᎨᎤᏍᏉᏟ, meaning “Black Belly”) are fairly consistent across the survey sites, we can observe that Seal Salamanders are present in greater numbers in Loan Branch than they appear to be at the Upper Dorsey site. What’s going on?
Figure 2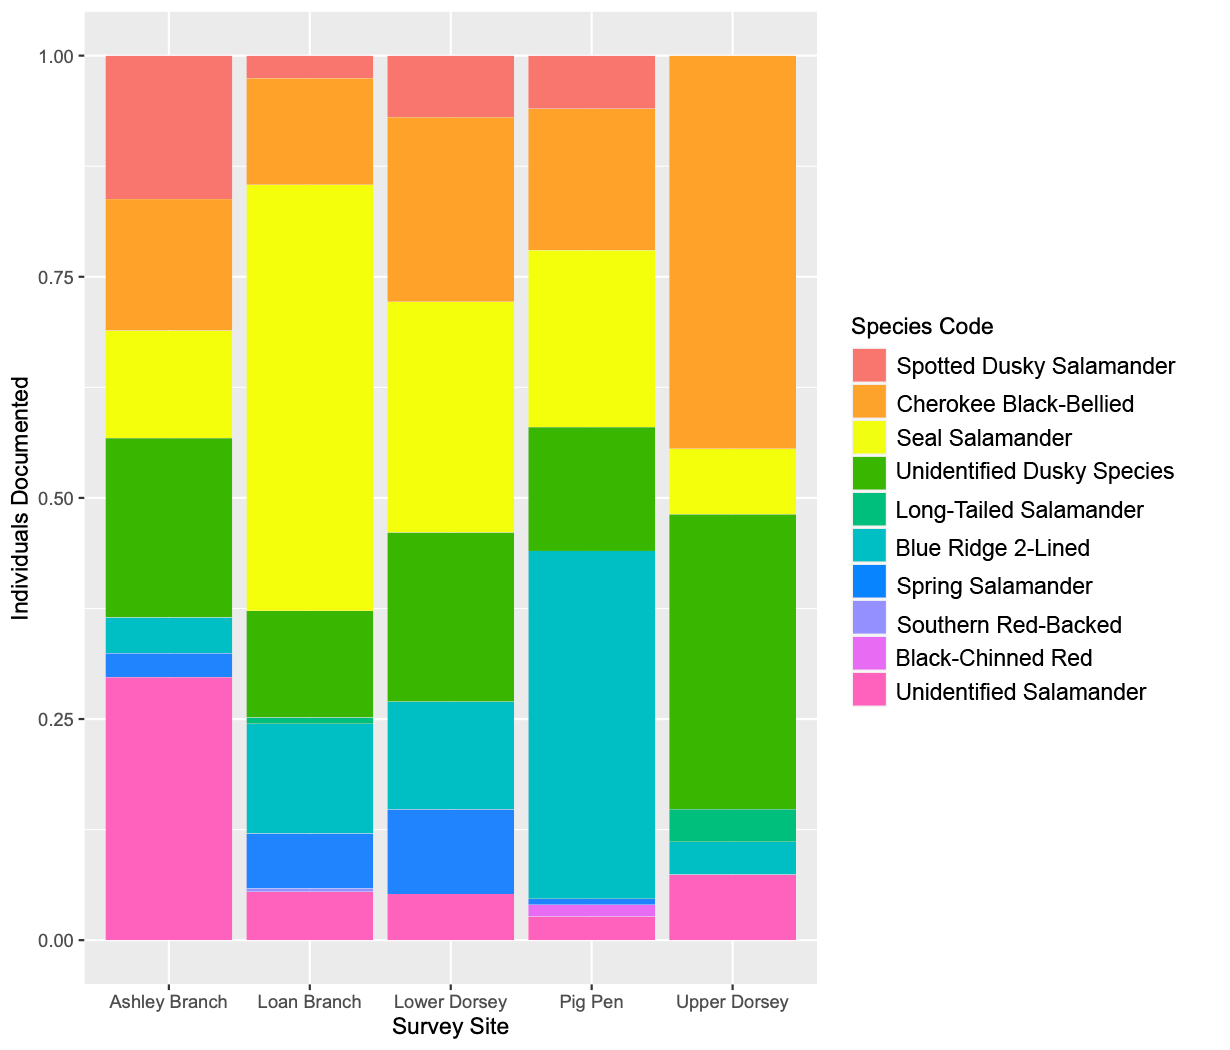 Figure 2: Relative abundance of salamander species by stream site. Note that each site has a different n. Refer to Table 1 for n values by stream. Graphics created using RStudio data analysis software.To clarify, let’s look at an alternate representation of the same data.
Figure 2 represents the relative abundance of each species as a function of the total number of salamanders surveyed at each site. We might think of it as a shorthand for the likelihood that, for example, a newly-captured specimen at Upper Dorsey will turn out to be a Seal Salamander (roughly 10%, a much smaller chance compared to the Loan Branch site). We might also observe that a study at Upper Dorsey yields a higher chance of finding the relatively elusive Long-Tailed Salamander compared to the other streams. Does some habitat feature there curate the ideal conditions to support a higher population of this species? Does that specialization come at the expense of other species, such as the Spotted Dusky Salamander, which was not documented at Upper Dorsey?
There’s so much more to learn! In the end, our data leads us to further questions. How might we quantify the differences between the sites? Is water temperature the operative factor? Elevation or pH? One key consideration is that Upper Dorsey was surveyed far less often than Loan Branch during the years this data was collected. Both additional data and additional analysis are needed to isolate and interrogate the trends suggested by these graphics. Deeper understanding of Tremont’s salamanders, our ecosystem, and even global climate science is at our fingertips (or better yet, in our bags and buckets). Some researchers have suggested that Seal, Dusky, and Spring Salamanders are increasingly moving upstream (Clipp & Anderson, 2014). Could this be evidence of a retreat to higher altitudes in the face of anthropogenic habitat degradation or temperature extremes? Making sense of our changing planet may require tiny creatures, big data, and wet boots in streams worldwide.
Learn more about our aquatic salamander monitoring protocols. Interested in getting involved? Contact Erin via erin@gsmit.org to learn more about adopting a site!
*Why claim 8 salamander species when 9 appear to be represented the tables and figures? Salamanders from the genus Desmognathus– including Seal, Spotted Dusky, and Cherokee Black-Bellied species– are virtually indistinguishable at the larval stage, leading to a category abbreviated as DESSPP, or Unidentified Dusky Species. Given that DESSPP is most commonly used to label larvae, a high percentage of green in the column graphs, as at Upper Dorsey, might imply importance as a breeding site. Further study is needed.