Community Science in 2022
Community science (formerly called citizen science—read why we made the change in name) is public participation in scientific research. Students, teachers, and other community members use their skills of observation to contribute to important scientific research that can help us better understand the world.
At Tremont, we are using community science as an invaluable tool to connect people with nature. Hands-on experience with real research projects engages and excites students and volunteers. They develop a deeper connection to place through the projects and realize that they are contributing to something bigger than themselves.
In 2022, each of our community science volunteers made observations of trees, wildflowers, salamanders, butterflies, amphibian eggs, birds, soil respiration rates, or any number of the incredible natural phenomena that surround us. Their attention to detail and contributions to monitoring projects for Great Smoky Mountains National Park and national research programs help all of us better understand the world and our place within this ecosystem.
Explore our interactive research report to learn more about the amazing species we observed, studied, and learned from in 2022.
Phenology
For many decades, Tremont staff, volunteers, and participants have contributed to our research, recording different “Signs of the Season” as the environmental conditions shift throughout the year. From “First Frost” to “Wood Frogs Mating,” we record all the firsts to monitor the stability or variability in the timing of seasonal events.
Noticing the signs of the season year after year allows us to connect more deeply to this valley. Each spring, the song of the first Black-Throated Green Warbler or the first trillium coming up from the soil is like seeing an old friend. Their arrival also helps us understand the cyclical nature of time and shows us how our local species or seasonal indicators are adapting to climate change in each subsequent cycle. Take a look at the graph below that shows the arrival of the first frost each fall:

Figure 1. First hard frost of Walker Valley from 2000-2022. Note that in 2022, our first freeze was earlier than it had been since 2006. Overall, a pattern of later arrival of the first freeze is seen.
While the data only goes back 22 years, we are starting to see a trend that the first frost is sweeping Tremont later and later each year. We need many more decades of data to draw definitive conclusions. Still, these patterns help us know what to watch for, and all the impacts a later frost might have (e.g. mosquitoes and ticks stick around later, and migratory species may not leave at the same time).
Curious about which species we notice throughout the year? You can check out our seasonal lists here. If you live in a very different climate or region from the Great Smoky Mountains, you can make your own lists by first paying attention to when you spot the signs of your seasons with the use of a phenology journal or a phenology wheel.
For their ears, eyes, and excitement to welcome species and phenomena back to the valley each cycle, a huge thank you to the Tremont staff. In particular Logan Rosenberg, Wren Logan, and Lindsey Kessler who made the most first observations for 2022.
National Phenology Network
All over the Great Smoky Mountains National Park, volunteers adopt plots of trees and wildflowers to record observations of their year after year. Our phenology volunteers are some of our most committed volunteers, as they come to observe their plants weekly during the height of Spring and Fall.
Every Spring and Fall before the trees start to change, our phenology volunteers meet up to discuss protocols, share better practices, and visit each others’ sites. This gives them a chance to answer questions about some of the trickier phases to observe. Each tree has different observable traits unique to the species, and accuracy in the data is key to creating models to understand everything from climate change to predicting the height of pollen season! It might seem easy to notice when a leaf bud is breaking open up close, but what about noticing these changes for a massive Tulip Poplar 80 feet up in the canopy?

Tremont phenology volunteers and Erin Canter, manager of science literacy and research, work together to observe the start of Fall in 2022. Photo by Hannah Metcalf.
The observations from Tremont’s volunteers, along with thousands of other volunteer scientists across the country, show that spring phenophases were observed earlier than normal the past few years. In addition to changes in land use, warmer temperatures in some regions and anomalous cold in others due to climate change impact the timing of seasonal events. This has many implications for the species that depend on these trees for food and habitat. Check out the data visualization for the arrival of spring from the National Phenology Network.

From the National Phenology Network: Spring bloom has arrived in southern states, days to weeks early in the Southeast, and days to over a week late in the Southwest. Spring bloom is ten days late in Las Vegas, NV, and 22 days early in Norfolk, VA. Get more information and to learn how these images were created.
The observations from Tremont’s volunteers and thousands of other volunteer scientists across the country show that spring phenophases were observed earlier than normal in the past few years. In addition to changes in land use, warmer temperatures in some regions and anomalous cold in others due to climate change impact the timing of seasonal events. This has many implications for the species that depend on these trees for food and habitat. Check out the data visualization for the arrival of spring from the National Phenology Network.
For their dedication and observations year after year, thank you to Cheryl Brodbeck, Gail Broxson, Karen, Daniel and Hannah Metcalf, Sarah Geagley, Mark Weingartz, Mac Post, Donna and Steve Higdon, Travis Whitehead, Terry Uselton, and Allison and Rodney Pearson.
Background image by Karen Gravagna, taken during our Spring Photo Workshop.
Vernal Pond-Breeding Amphibians
In mid to late winter, slightly warmer temperatures and rainy nights will result in a mating frenzy for both Wood frogs (Lithobates sylvaticus) and Spotted Salamanders (Ambystoma maculatum). In early February of 2022, a small group of Tremont staff and volunteers visited a known breeding location of wood frogs within the park on a warm night and were rewarded with a chorus of thousands of wood frogs finding mates and laying eggs in ephemeral ponds.
Throughout February and March, volunteers visited 7 once every 13 days to count the new eggs that were left in pools by salamanders and wood frogs. By adding up all new deposits of eggs from each count, we can determine the total number of laying female frogs and salamanders over the season. See how our numbers this year compare to previous years using the visualization below:

Figure 2. Spotted Salamander and Wood Frog egg mass counts in all study sites over time from 1993-2022.
Wood frogs and Spotted salamanders are not the only critters to use these vernal ponds. Earlier in the season Marbled Salamanders (A. opacum) deposited and then guarded their eggs until the pools filled with water. By the time our monitored species are laying, the marbled babies are already swimming around in their larval stage!
A healthy amphibian community indicates a healthy ecosystem, as amphibians are vulnerable to changes in air and water quality as well as introduced viruses and feral hogs. We rely on our volunteer team to keep records of these indicator species so we can assess their population over time.
For donning waders and braving frozen ponds, thank you to: Walt Peterson, Mark Weingartz, Mac Post, and Laura Dixson, and thanks also to Tracy Tolley Hunter for inputting many sheets of data.
Mac Post scribes while Laura Dixson measures the depth of one of the vernal ponds near Finley Cane. Photo by David Bryant.

Marbled Salamander larva swimming over wood frog eggs on an icy day in February. Check out those gills! Photo by Erin Canter.

Wood frogs mating in an ephemeral pond. Photo by John DiDiego.
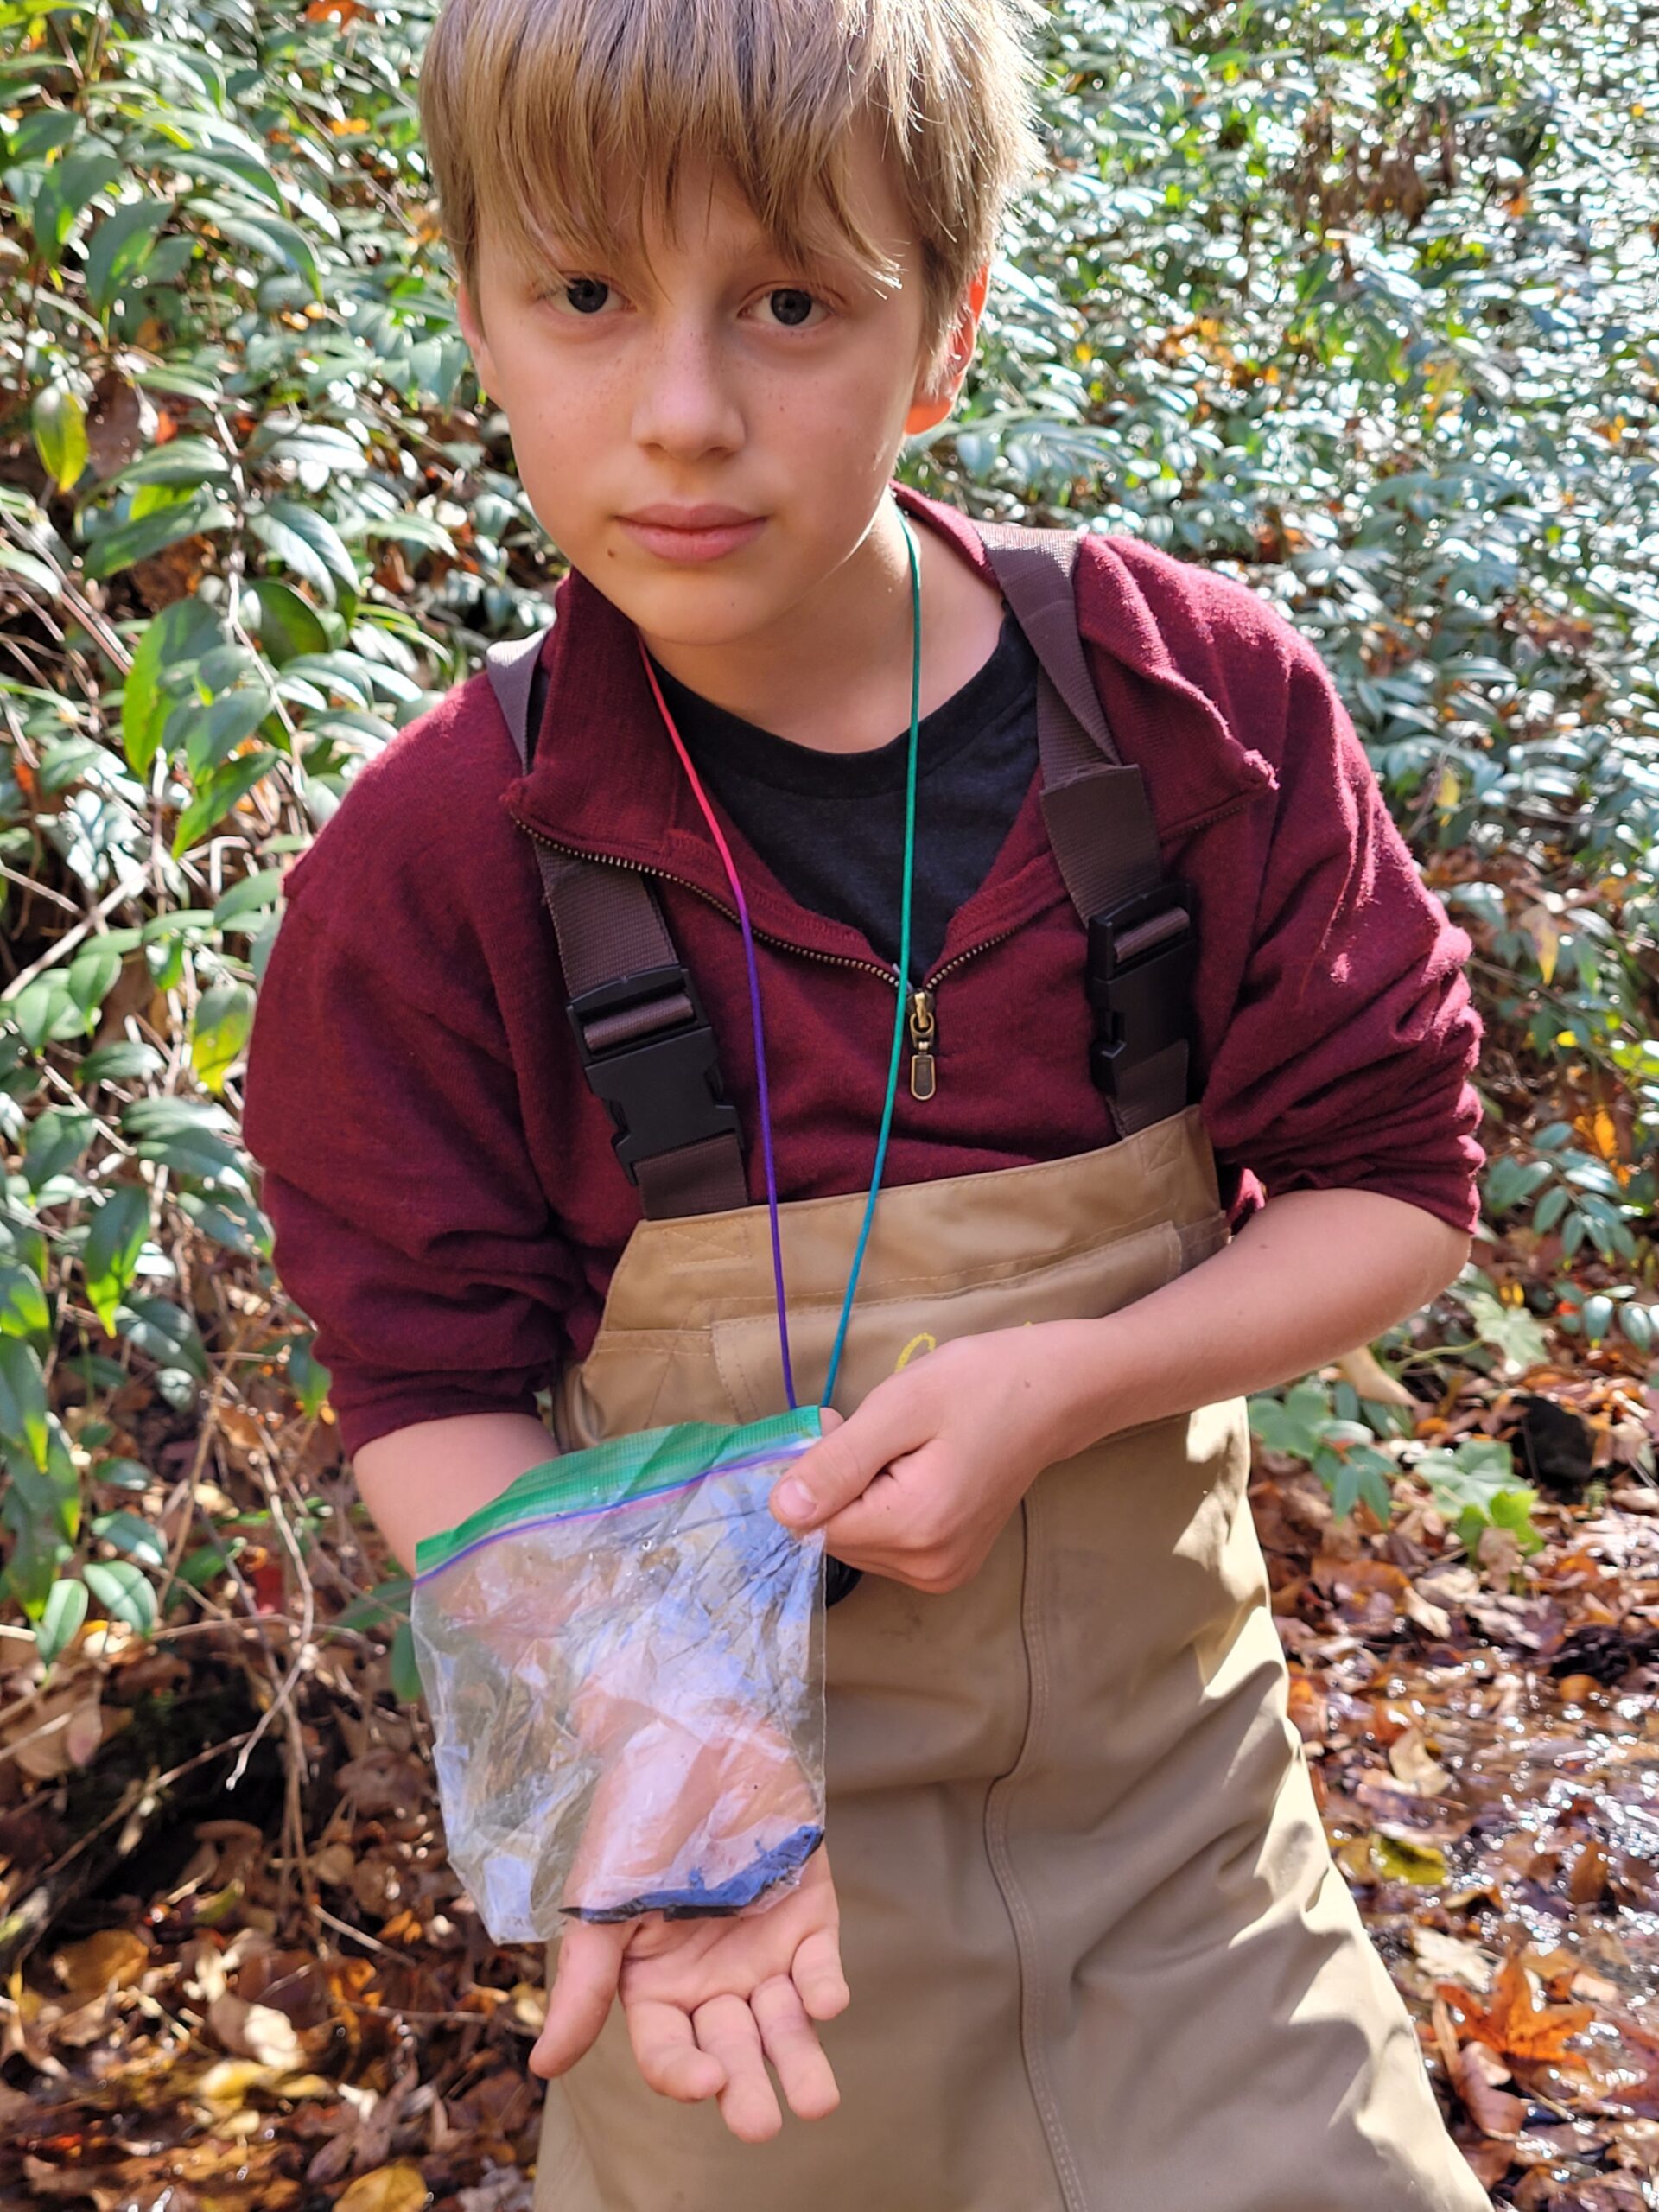
Aquatic Salamander Monitoring
With 31 species and counting* the Great Smoky Mountains National Park has a greater diversity and total number of salamanders than anywhere else in the world for its size!
To keep track of our local salamander populations, Tremont staff and volunteers have been surveying six different streams since the 1990s to assess our salamander species and over time.
One of our streams, Ashley Branch, is located next to the ranger station about a mile down Tremont Road from the Institute. Volunteer Rory Ferguson and his grandfather Tom Dittmaier have been visiting the site once a month for the past year and recording the species they find according to our monitoring protocol (Figure 3).

Figure 3. Salamander species recorded in Ashley Branch from January to October 2022, group by season. “Dusky Species” indicates a salamander of Desmognathus that could not be identified to species. UNIDENTIFIED indicates the salamander could not be identified to family or genus.
Rory Ferguson and a Black Belly salamander. Photo by Tom Dittmaier
There are quite a few patterns to note that tell us both about the salamanders and the citizen scientists themselves! Rory and Tom adopted Ashley Branch for monitoring in November 2021, meaning this was the first full year of monthly site visits. Notice how the category “UNIDENTIFIED” goes from very large to very small. Monitoring salamanders can be tricky and requires great attention to detail, close following of protocols, and a long-term commitment. This graph shows why: after just one year, Tom and Rory are now significantly more confident in the identifications they record, which gives us a much clearer picture of salamander diversity.
Community and Citizen Science not only helps researchers and land managers understand ecosystems better, but participation in projects also helps volunteers connect to the land and hone their scientific skills of detailed ecological observation.
Curious to know how Ashley Branch compares to other streams survey sites? Check out this excellent overview by Grayson Shelor, current Teacher Naturalist and 2021 George Fry Chair Community Science Educator.
For their attention to detail and care for our streams and their inhabitants, thank you to Holly Hoyle and Flint, the Littleton Family, Rory Ferguson and Tom Dittmaier, Ailish Garrett, Wren Logan, Mark Weingartz, and Cheri Hall.*In 2022, DNA analysis resulted in a split of our Black-bellied salamander into distinct species. (See Pyron, Alexander R. & David A. Beamer. 2022. “Nomenclature solutions for diagnosing ‘cryptic’ species using molecular and morphological data facilitate a taxonomic revision of the Black-bellied Salamanders (Urodela, Desmognathus ‘quadramaculatus’) from the southern Appalachian Mountains.” Bionomina.) Those found in the Tremont area are now known as Cherokee Black Bellied salamanders (Desmognathus gvnigeuswotli) derived from the Cherokee words gvnige meaning “black” and usgwotli meaning “belly.” Salamanders in the genus Desmognathus are the most common salamanders found in our streams at Tremont. (See: https://gsmit.org/making-sense-of-salamanders/)
Background image by Michelle Campbell


")

")
")
")
")

")

")

")

Images by Rich Bryant.
Butterflies and Monarchs
Our butterfly education programs in Cades Cove are about more than just tagging monarchs! Check out this video from Discover Life in America’s Science at Sugarlands series where Erin describes some of the goals and outcomes of our butterfly program:
Of these hundreds of members of our community to come to Cades Cove to learn and play and engage in science, the vast majority were led by our volunteer educator team. A huge thank you to Cheri Hall, Amanda Davis and Rachel/Riley, The Metcalf Family + Sarah/Maddie Geagley, Mark Weingartz, the Petersons, Laura Mallette, Wanda DeWaard, Juli Rigell, Gar Secrist, Mac Post, Terry Uselton, and Carrie Schmitt.
Images by Rich Bryant.
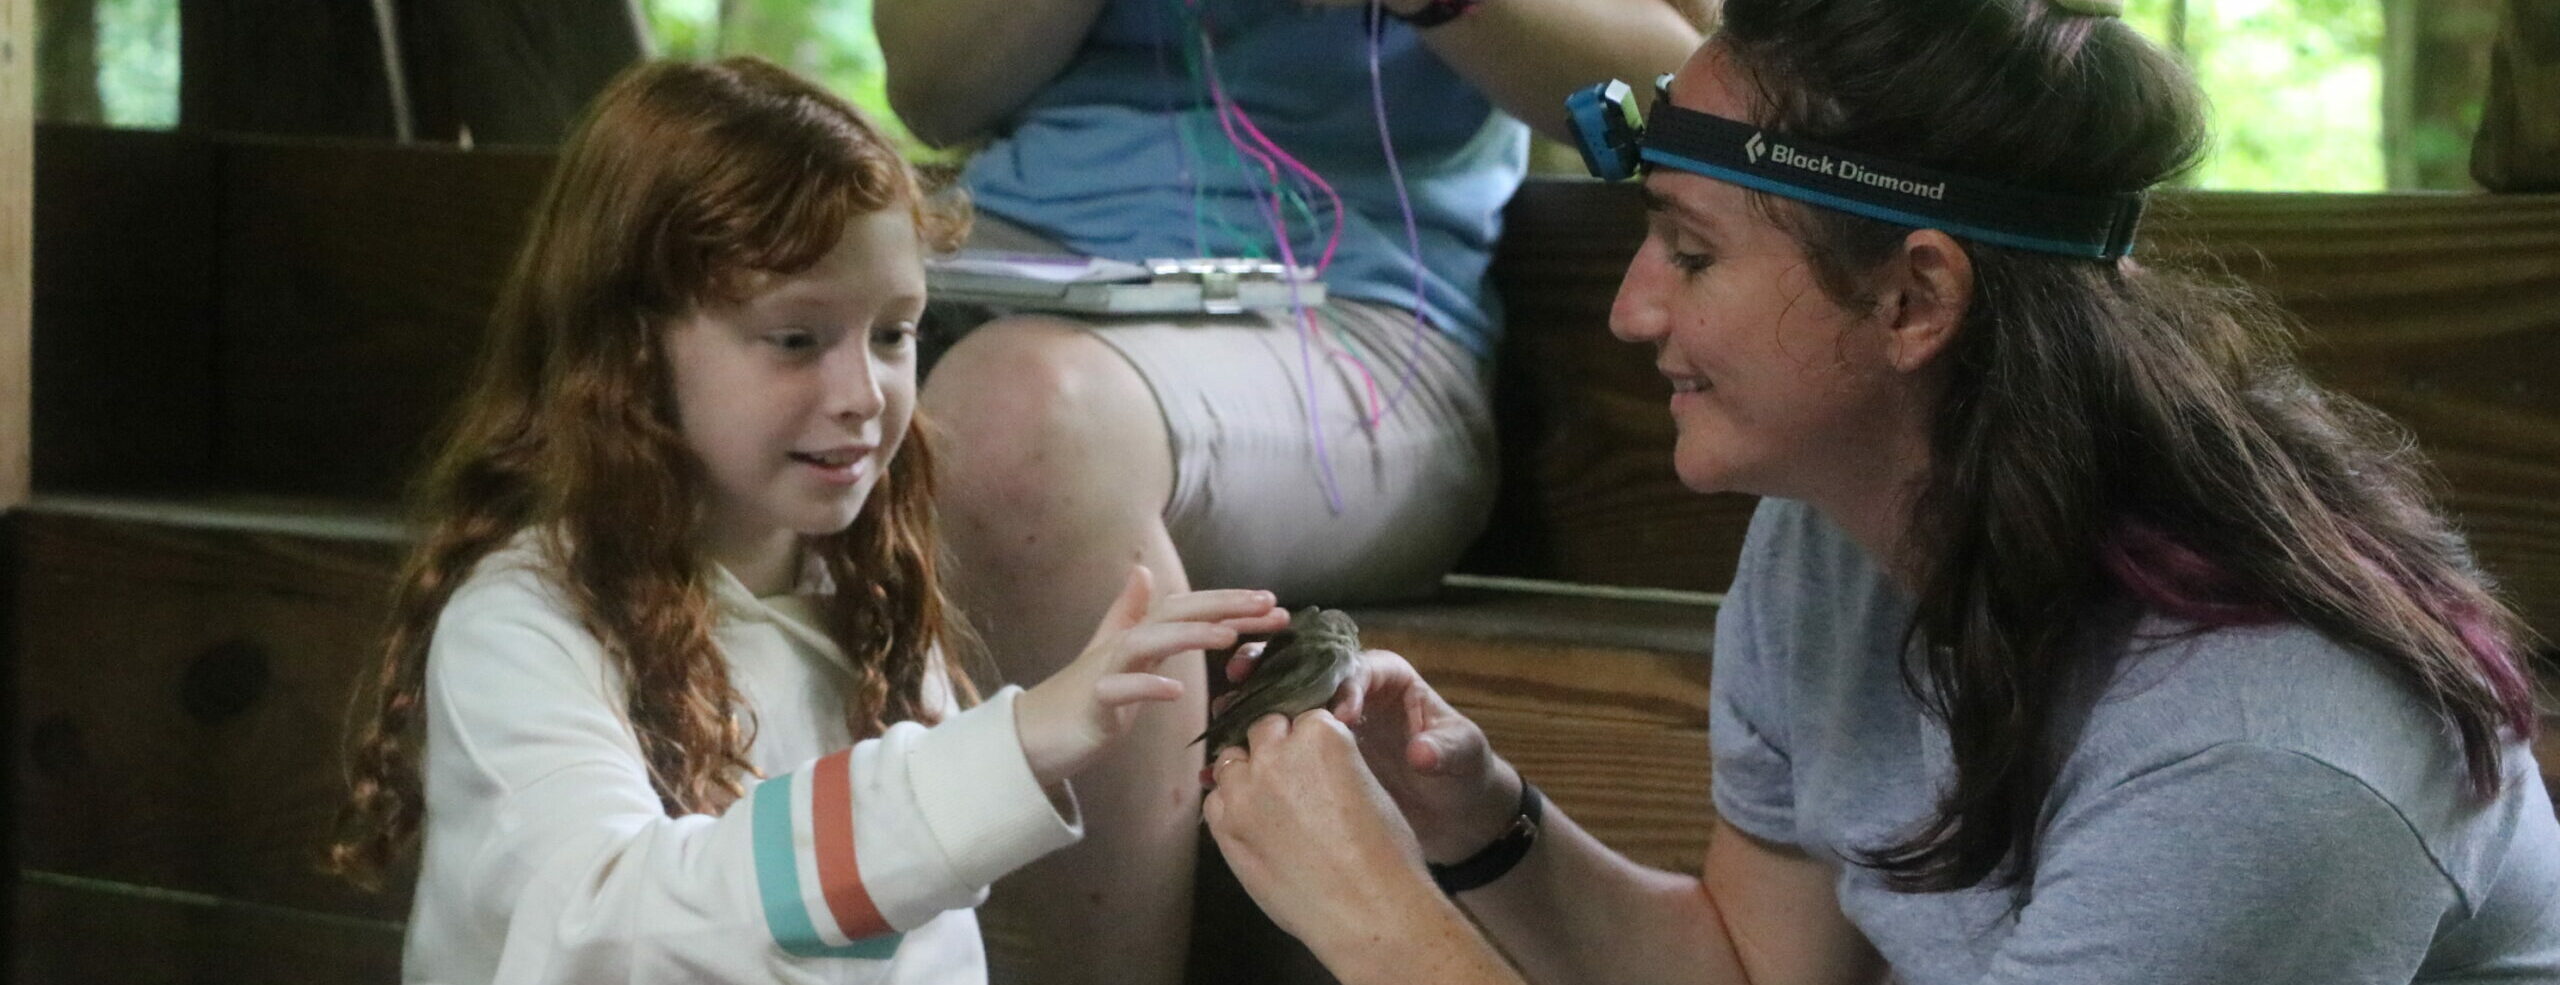
Bird Banding
Each year we welcome our summer avian residents back to the valley from their overwintering sites to the south. Our study of birds and their behaviors is twofold: we record the first arrival of our migrating species in early spring, and then in the summer we catch birds and record data about them.
The latter involves capture and release according to the Institute for Bird Populations’ protocols for Monitoring Avian Productivity and Survivorship. We have run this banding station following these same protocols since 2000. With the help of a core team of trained volunteers, we set up nets once every 10-day period from late May until early August. The periods are the same every year, which allows us to compare data across time. Because of where we are located regionally, we begin banding in MAPS period 3 (Figure 4).

Figure 4. Recommended starting periods for MAPS stations as suggested by the banding manual from the Institute for Bird Populations. These dates are meant to capture the courting, nesting, breeding, and fledging of our summer migratory species.
Period One: May 1-10
Period Two: May 11-20
Period Three: May 21-30
Period Four: May 31-June 9
Period Five: June 10-June 19
Period Six: June 20-29
Period Seven: June 30-July 9
Period Eight: July 10-July 19
Period Nine: July 20-July 29
Period Ten: July 30-August 8
With this data, we can start to notice patterns in the timing of bird activities in our valley (Figure 5).

Figure 5. Average number of birds caught in mist nets per period over the banding season from late May until early August. Number of birds caught peaks in Period 5, which occurs in mid June. Colors simply denote the changing season.
But wait! We hear all kinds of summer birds starting way before June, like the familiar zeezeezee zo zee of our Black-Throated Green Warblers or the exciting zipper trill of the Parula Warblers. So why does the number of birds peak in June? Well, it turns out this trend is driven by our most commonly caught species: the Louisiana Waterthrush. Take a look at their trends (Figure 6) and notice the similarity with the graph above:

Figure 6. Average number of Louisiana Waterthrush caught per period from 2000-2022. A “Hatch Year” bird is a bird that was born in the same year that they were caught. Birds labeled “After Hatch Year” were born in a previous year, meaning they had completed at least one migration and returned to Tremont for breeding and summer residence.
It seems the influx of baby LOWAs in June drives these high numbers. There is a sharp decline in birds we capture in July and August, as birds completely fledge the nest and even start their southern migration out of the valley.
Note that just because we catch more LOWA than any other species does not mean they are more abundant. The nets are placed near the river and only as high as we can reach, so all of those little canopy warblers are safe from the nets. In contrast, the feeding behavior of Louisiana Waterthrush keeps them closer to the group and more susceptible to capture.
Under the umbrella of both birds and phenology, staff and volunteers write down the first time they hear or see one of our summer residents each spring. In this way, we can keep track of the patterns of arrival for our resident birds (or blooms for flowers or songs of cicadas). Take a look at the graph below, created using this data collected by staff and volunteers (Figure 7):

Figure 7. Date first heard or seen of Louisiana Waterthrush in Walker Valley each Spring. Data missing from 1987-1991.
Notice that the Louisiana Waterthrush, along with many of our other migratory summer residents, begin to arrive in the spring months before we begin our banding program, and before their young begin to hatch and fledge. Notice also that, though it is not yet statistically significant, these birds are arriving earlier and earlier. Climate change, specifically a warmer climate both in their overwintering sites and their migratory route, is likely affecting the behavior of birds. Over time, these trends may impact the timing of breeding, fledging, and the return migration to wintering sites. If the resources these birds depend on (such as insects) do not also shift, there could be lasting impacts on the population numbers for these birds.
For their before sunrise mornings, careful handling of birds, and engagement with the public in education a gigantic thanks to the Metcalfs and Sarah Geagley, the Dattilos (including Annabel who modeled careful extraction for Girls in Science), Holly Hoyle, Gar Secrist, Will Kuhn + DLIA interns, Julio Campis-Diaz, and Cassandra Waldrop and her team of sleepy salamander scientists.iNaturalist
Contributor: Will Kuhn, Director of Science and Research at Discover Life in America
Perhaps the simplest way to get involved and connect with the Smokies, your local park, or even the vegetation and critters around your home is to start paying attention to the diversity of life around us.
An app that helps facilitate such attention is iNaturalist, a massive Citizen Science undertaking and favorite tool of fellow park partner Discover Life in America (DLiA).
DLiA’s Director of Science and Research, Will Kuhn, explains further:
“Anytime you use the iNaturalist app to post photographs or sound recordings of life you find in the Smokies, you’re contributing to science! DLiA uses species observations contributed by park visitors to map life in the park, to monitor rare and exotic species, and even to discover new species in the park. Visitors can also take things up a notch by seeking out and recording certain target species on the Smokies Most Wanted list.
In August of this year, a park visitor made the 100,000th iNaturalist species observation in the park, and in December 2022 we surpassed 5,000 species recorded in iNaturalist. There are currently 7,715 iNaturalist users that have recorded species in the park and another 4,947 who’ve helped identify them, and so far they’ve helped document 110 species that are new records for the Smokies! Amazing!”
To find out more and contribute to research on your own time, visit the following links:
Recently Around Tremont
Otters
River otters once again call the Smoky Mountains home after being by European settlers by the early 1900s. Check out this video by Rocky Top Videography, where Erin sheds some light on the history of these precious and playful mammals, and how you can help researchers and the public understand the land and rivers they live within.
It’s Your Turn to Be an Otter Spotter!
To help, keep an eye out for quick fluid movements in the water. Otters will often slide over rocks, chirp with one another, and then dive under to quickly swim underwater, popping up many meters away. Another fun way to get to know otters is by looking for the tracks and signs they leave behind. A great place to look for footprints is under bridges or next to rivers where wet sand temporarily preserves their tracks. Otters also use latrine rocks, where groups of otters will return to the same area to leave fishy-smelling scat behind! These signs are just as important for researchers to understand how these charismatic and playful mammals use their environment. Upload any otter sighting OR photos of scat and tracks of otters to iNaturalist’s Otter Spotter project.
Background image by David Huff
Recent Otter Observations
|
View more observations from Otter Spotter in Great Smoky Mountains National Park on |


